
You cannot optimize a room
you cannot fully measure.
CropVision is the visibility and intelligence layer for Total Crop Steering.
It helps operators understand how the room, the root zone, and the crop are actually responding so they can diagnose performance, steer more precisely, and improve outcomes over time.
There is a difference between having sensors
and being able to diagnose the room.
A few sensors in a 4,000 sq ft room do not give you visibility. They give you a simplified average. Microclimates are real. Root-zone conditions vary. And the difference between one part of the room and another is often the difference between consistency and avoidable waste.
CropVision was built to make those differences measurable. Instead of reducing the room to one or two points, it helps operators understand what is happening across the zone, how the environment is interacting with the crop, and whether steering targets are actually being hit.
That is what turns monitoring into decision support. Better visibility does not just give you more data. It gives you the context needed to diagnose performance, correlate actions to outcomes, and understand what to improve next.
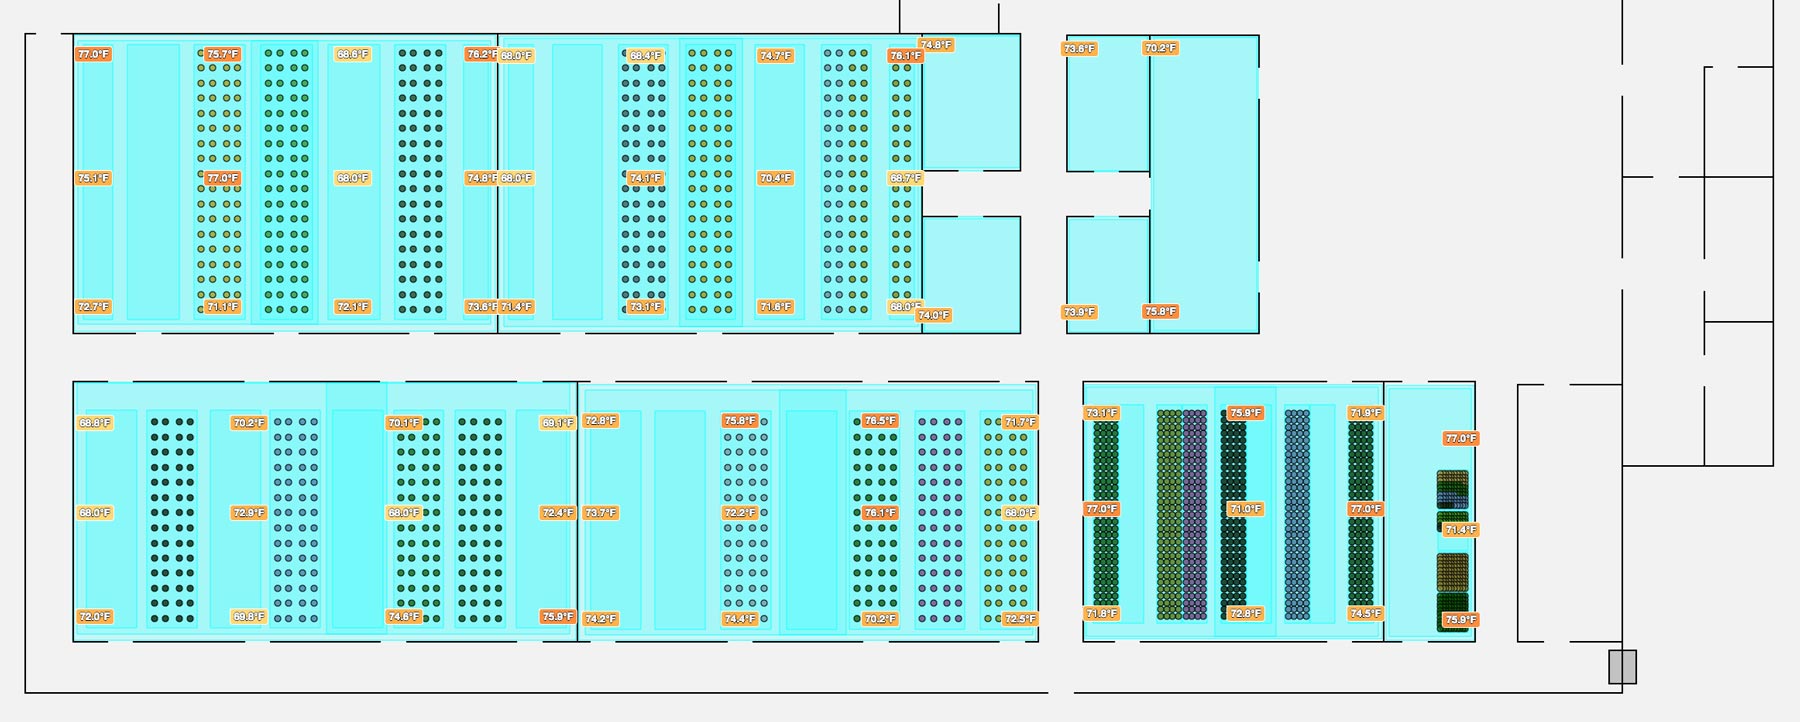
Real CropVision microclimate map: spatial T/RH distribution across every zone in your facility
The conditions you need to measure
to understand what the room is doing.
CropVision does not just collect environmental data. It helps operators measure the variables that explain plant behavior, room variation, and the real effect of the system on the crop from transplant to harvest.
Vapor Pressure Deficit
Track plant-driven demand with zone-level VPD data that supports more precise environmental steering across each growth stage.
Daily Light Integral
Measure cumulative light dose so intensity and photoperiod decisions are based on what the crop is actually receiving.
Carbon Dioxide
Map canopy-level CO₂ concentration in 3D to identify enrichment dead zones and uneven distribution before they show up in performance.
Photosynthetically Active Radiation
Understand how light is distributed at canopy level so you can spot hot spots, shadowing, and fixture-performance issues.
Substrate Analytics
Monitor root-zone EC and water content so steering decisions are grounded in what is happening below the canopy, not guessed from the air.
Runoff EC + pH
Track runoff EC and pH so you can catch drift, nutrient imbalance, and root-zone issues before they show up as lost yield or quality.
Other platforms give you readings.
CropVision helps you understand the room.
The point is not just to add more sensors. The point is to understand where the room is drifting, how conditions vary across the zone, how the crop is responding, and what to change first. CropVision was built to deliver that kind of operational visibility and context without forcing a proprietary lock-in path.
| What you need | Legacy systems | CropVision |
|---|---|---|
| Zone-level resolution | Single-point readings | 3D microclimate mapping |
| Substrate intelligence | Air measurements only | EC, VWC, pH at the root zone |
| Actionable guidance | Raw charts | Decision-oriented monitoring |
| Hardware flexibility | Proprietary sensor lock-in | Open ecosystem (any sensor, any platform) |
| Cost of implementation | $$$$ enterprise contracts | ~60% less than comparable enterprise platforms |
Total Crop Steering™
Total Crop Steering™ is the overarching methodology behind Grownetics. It defines what conditions matter, what targets teams should pay attention to, and how operators improve steering decisions over time.
CropVision is the visibility and intelligence layer for that methodology. It helps teams measure the conditions that matter, understand how the crop is responding, and build a better basis for optimization.
- Stage-by-stage targets instead of one-size-fits-all recipes
- Visibility into canopy, root-zone, and room-level response
- Operational context that helps teams correlate actions to outcomes
- University-affiliated validation and field-informed refinement
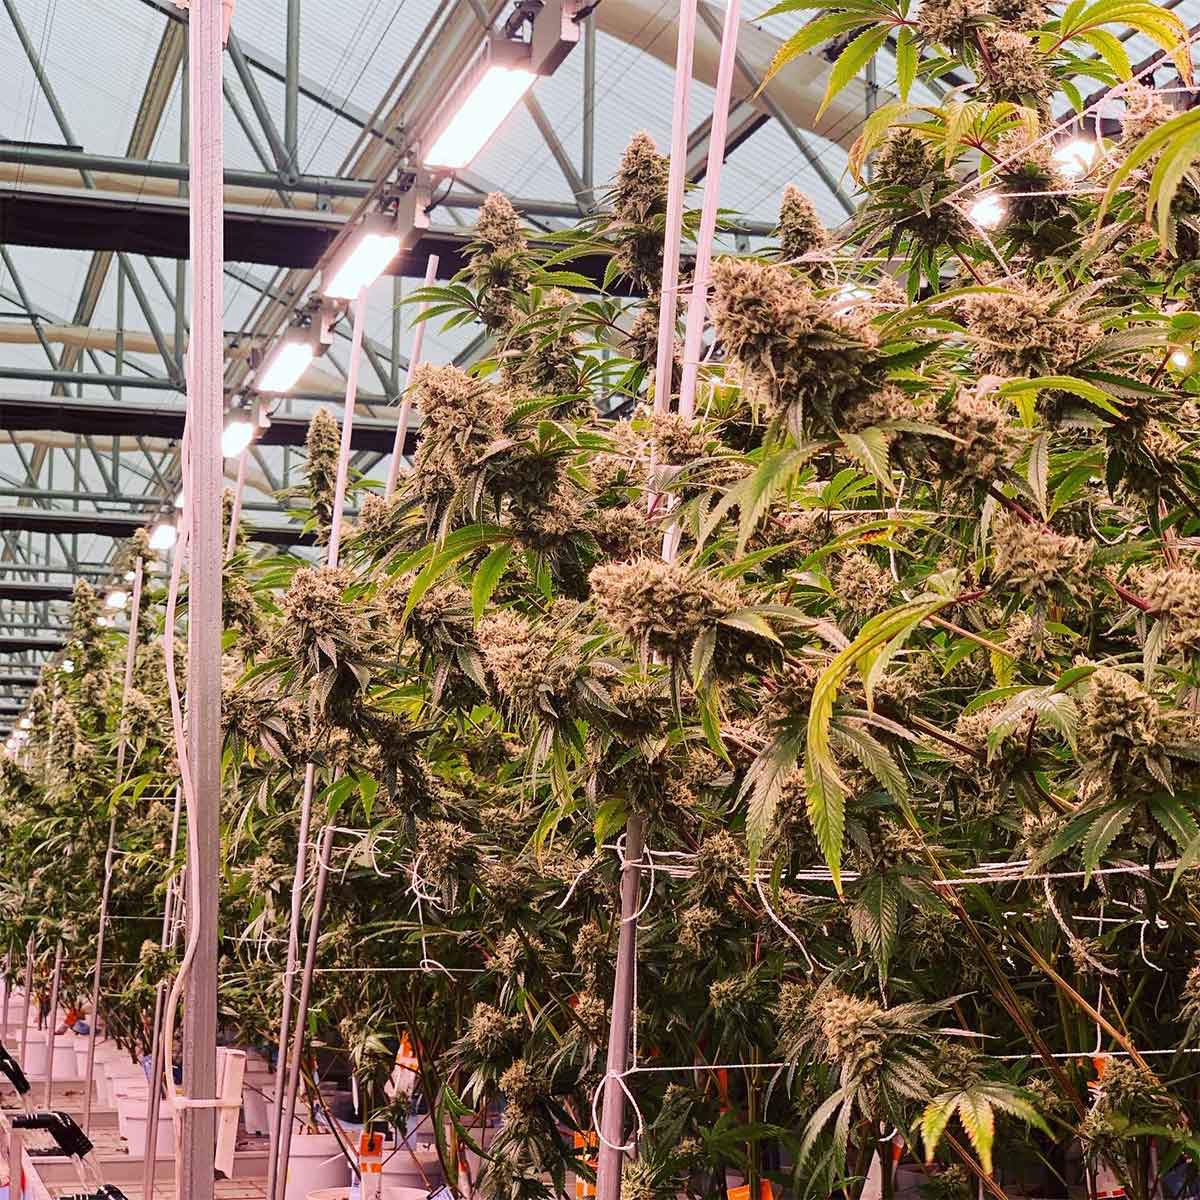
Built for real commercial cultivation
environments.
Built on real commercial CEA experience, with deployments across commercial cultivation, produce, and specialty crops in Colorado, California, Canada, and internationally.
"We had sensors before CropVision. We had data. What we didn't have was visibility. I couldn't tell you what was happening in the southeast corner of Room 2 versus the northwest. Now I can. And it changed how we manage every room."
Head Grower, 40,000 sq ft facility, CA
See your operation with 10x the resolution you have today.
Book a demo. We'll walk through CropVision in a facility similar to yours and show you exactly what you're not seeing.